Share this ![]()
April 7, 2025
1. Secured Overnight Financing Rate* (Q1 2024 – Q1 2025)
At the end of Q3 2024 the Federal Reserve decided to cut interest rates by 50 basis points and followed this up with an additional two 25 basis point cuts in Q4, trimming the Fed Funds rate and short-term rate indices like SOFR by 1% in total from the beginning of 2024. Since that time the Fed has put a pause on any additional cuts, which is why there’s been little movement in this index over this past quarter.
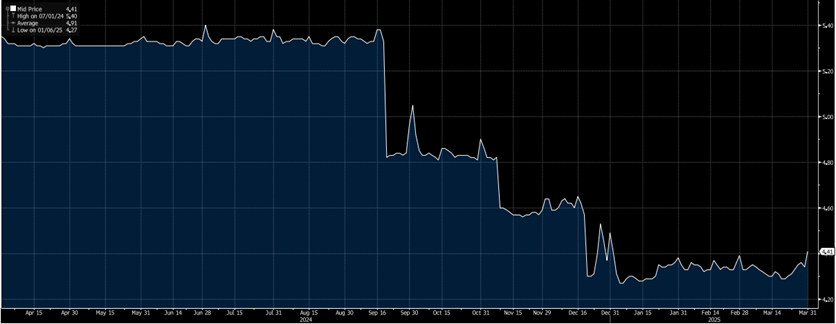
*SOFR is the average rate at which institutions can borrow US dollars overnight. It is currently the most common indices utilized to measure the short-term cost of borrowing for commercial real estate loans and will typically be used in conjunction with a bank spread to calculate a short-term, variable rate.
2. US 10-Year Treasury yield* (Last 5 years)
Since the beginning of the year, we’ve seen the 10-year Treasury gradually decline from ~4.50% to ~4.00%. The 10-year treasury peaked in mid-January, stemmed by fears of reaccelerating inflation data, a trend that continues to be fueled by tariff and trade policies. Bloomberg’s Ana Wong expects Core PCE to rise 0.5% this year, which would push it to 3.3%. Conversely, the economic growth projections are heading in the oppositive direction, with consumer spending data coming in weaker than expected and consumer confidence declining. This trend is likely what’s led to the reduction over the past couple of months.
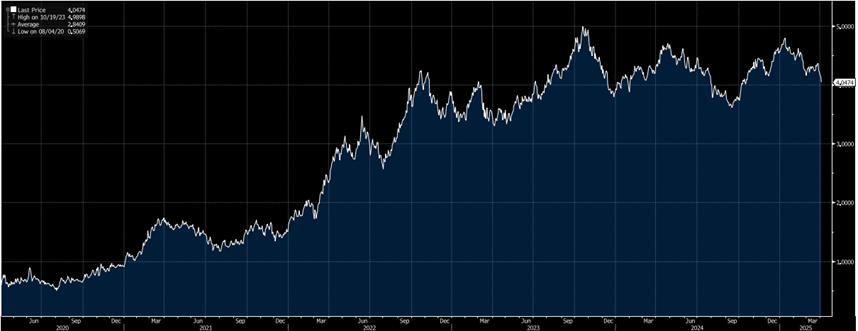
*The 10-year Treasury Yield is the return the government pays a purchaser for a 10-year treasury-backed bond. It is a good indicator of long-term interest rates and is oftentimes close to the cost of a bank lending capital for an equivalent period.
3. Treasury Yield Curve (Q1-2025 vs. Q4-2024)
The 2Y treasury closed 2024 at 4.25% but has since dropped by roughly 0.55%, while the 10Y treasury closed 2024 at 4.58% and dropped by a similar margin, indicating we’ve seen a drop in the cost of borrowing across the majority of the curve. This graph also helps to demonstrate that while floating rates are currently higher than the cost of 10Y money, the cost of short-term borrowing products, such as the 2Y treasury, are less than the cost of long-term borrowing.
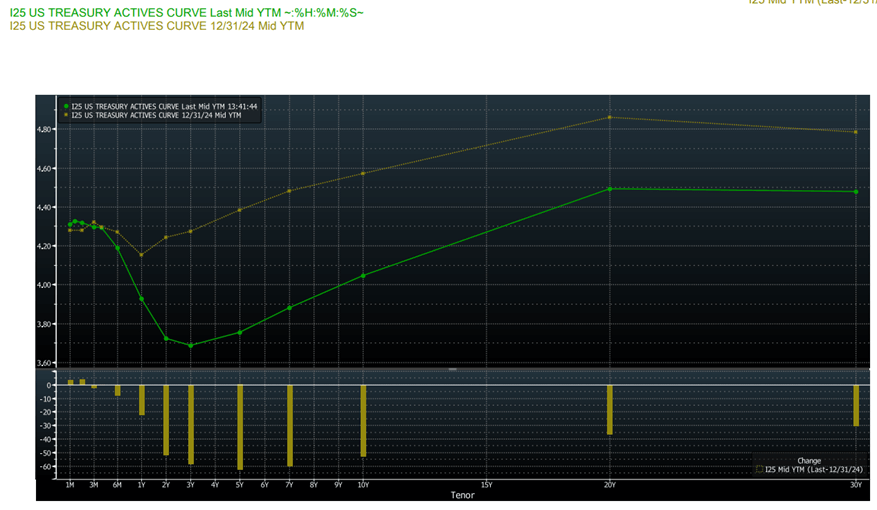
*Treasury yield curves demonstrate the relationship between interest rates and time to maturity. There are three main yield curve shapes: normal upward-sloping curve (where long-term rates are higher than short-term rates), inverted downward-sloping curve (where long-term rates are lower than short-term rates), and flat where interest rates are approximately the same regardless of tenor.
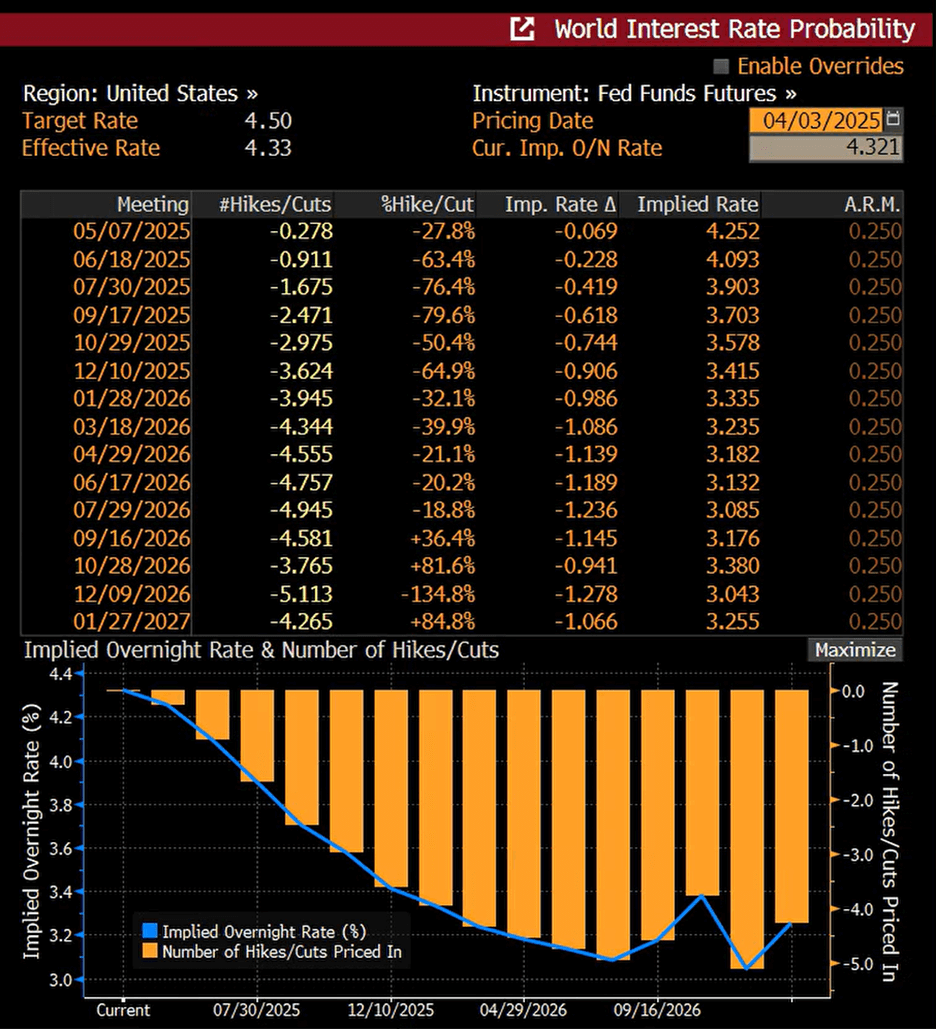
4. World Interest Rate Probability
The general consensus appears to be that the Fed will continue its pause through the May meeting and potentially cut 25bps in June, with that probability currently sitting at around 63%. The data appears to suggest that there will likely be between 2-3 cuts before the end of this year. While it may be hard to believe at this moment in time, if you look further out, you can also start to see the anticipation of potential rate hikes as early as September 2026.
by
Share this ![]()