Share this ![]()
April 8, 2024
1. Secured Overnight Financing Rate* (Q1 2023 – Q1 2024)
SOFR remains at roughly 5.32% until the Fed takes action to cut rates or hike them again.
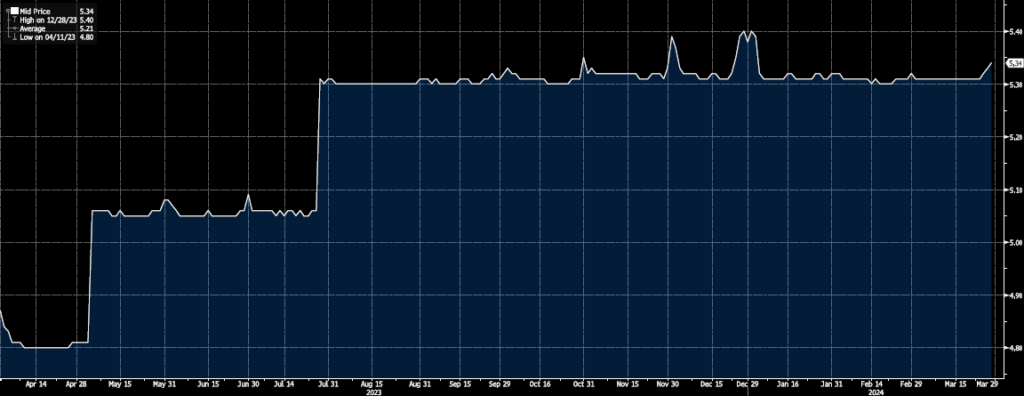
*SOFR is the average rate at which institutions can borrow US dollars overnight. It is currently the most common indices utilized to measure the short-term cost of borrowing for commercial real estate loans and will typically be used in conjunction with a bank spread to calculate a short-term, variable rate.
2. US 10-Year Treasury Yield* (Last 5 years)
Started the year at 3.92% and has crept upward to 4.35% as of this posting. The gradual rise may be attributable to the market’s growing belief in the Fed’s messaging that rates will be “higher for longer”.
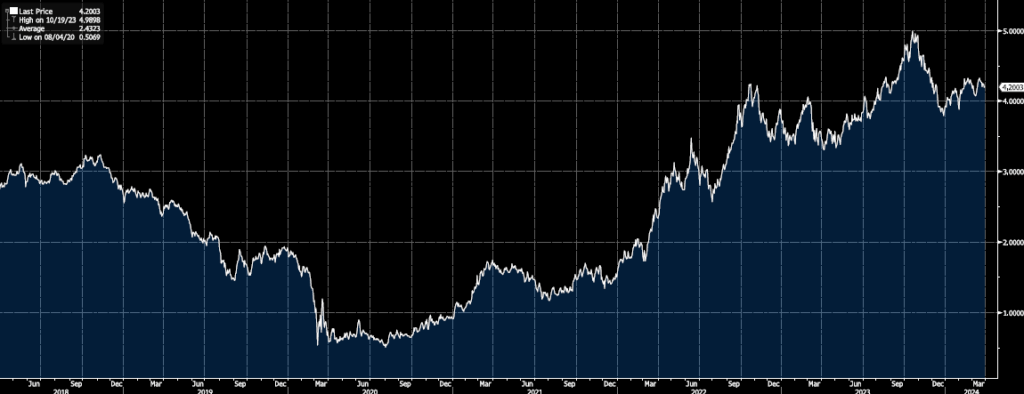
*The 10-year Treasury Yield is the return the government pays a purchaser for a 10-year treasury-backed bond. It is a good indicator of long-term interest rates and oftentimes close to the cost of a bank lending capital for an equivalent period.
3. Treasury Yield Curve (Q1-2024 vs. Q4-2023)
The yield curve remains inverted although it is slightly flatter than it was at the beginning of the year. What’s interesting is that the flattening is occurring at higher interest rates supporting the Fed messaging of “higher for longer."
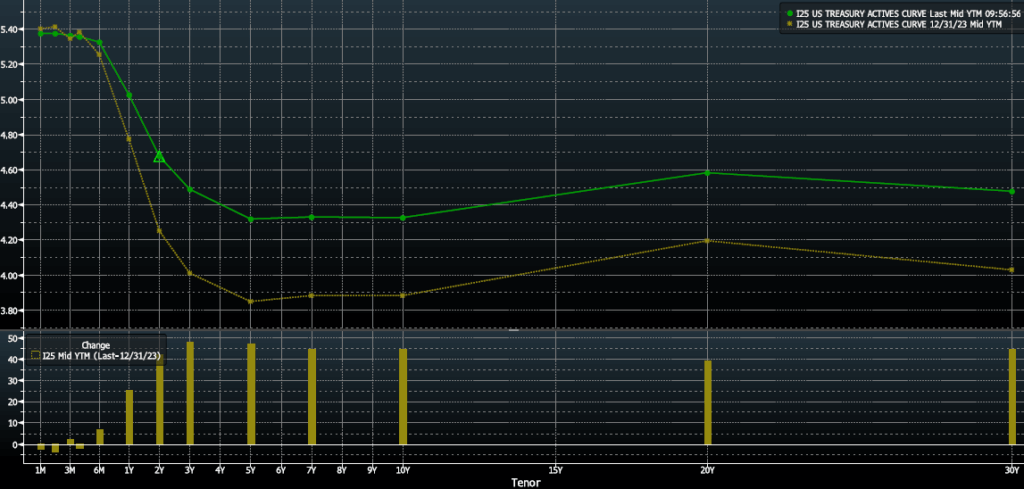
*Treasury yield curves demonstrate the relationship between interest rates and time to maturity. There are three main yield curve shapes: normal upward-sloping curve (where long-term rates are higher than short-term rates), inverted downward-sloping curve (where long-term rates are lower than short-term rates), and flat where interest rates are approximately the same regardless of tenor.
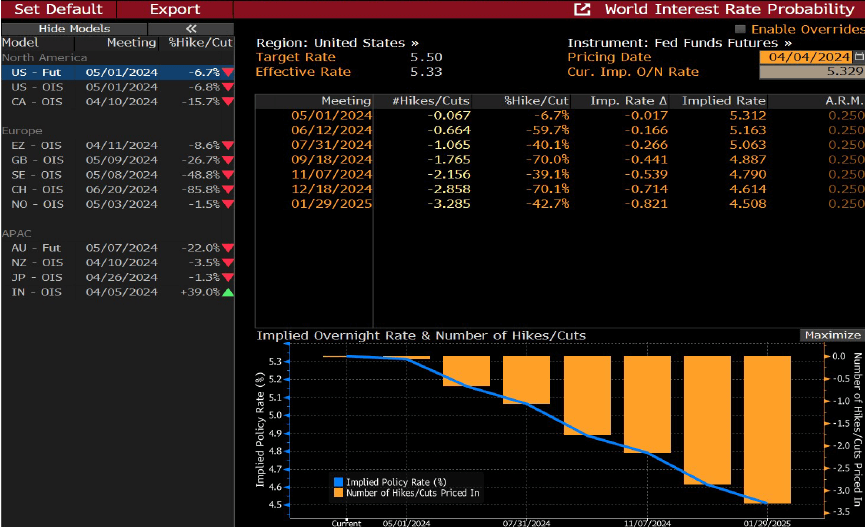
4. World Interest Rate Probability
Odds of a rate cut as early as June are still above 50% providing a small window of hope for the Fed to enact three rate cuts by the end of the year.
by Chris Tollinchi
Share this ![]()