Share this ![]()
January 4, 2024
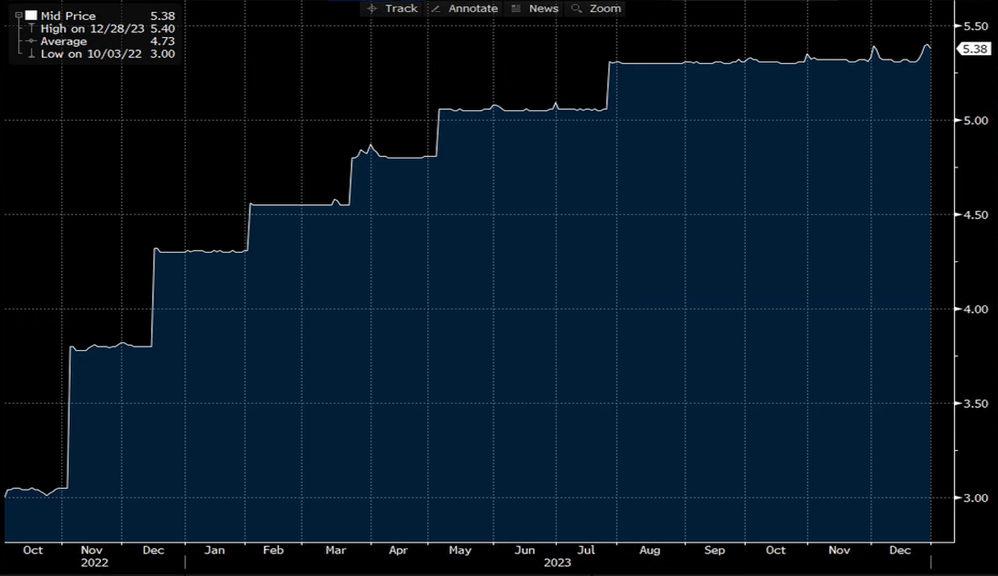
1. Secured Overnight Financing Rate* (Q4 2022 – Q4 2023)
Starting Q4 2022 at approximately 3.00% SOFR has gained roughly 2.38% to achieve its current level of 5.38% which is commensurate with the rate hikes that have been implemented by the Fed over the last 12 months. It is worth noting that over the last two FOMC meetings, the committee has voted to pause rate hikes, leading some to believe this is a signal to a more accommodative Fed in 2024.
*SOFR is the average rate at which institutions can borrow US dollars overnight. It is currently the most common indices utilized to measure the short-term cost of borrowing for commercial real estate loans and will typically be used in conjunction with a bank spread to calculate a short-term, variable rate.
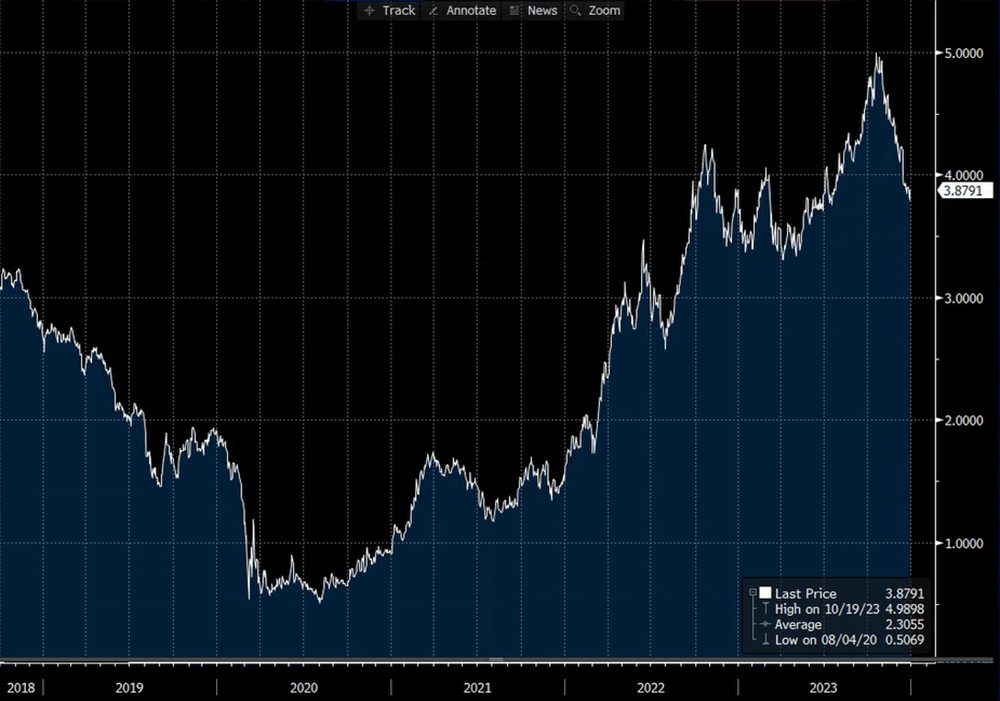
2. US 10-Year Treasury yield* (Last 5 years)
In Q4 2018 the 10-Y Treasury yield was at approximately 3.18%. During the pandemic, the 10-Y Treasury yield hit lows of 0.50% then began to rise. The 10-Y Treasury rate peaked at 5.00% in mid-October, and very quickly retreated to the current level of 3.88%
*The 10-year Treasury Yield is the return the government pays a purchaser for a 10 Year treasury backed bond. It is a good indicator of long-term interest rates and oftentimes close to the cost of a bank lending capital for an equivalent period.
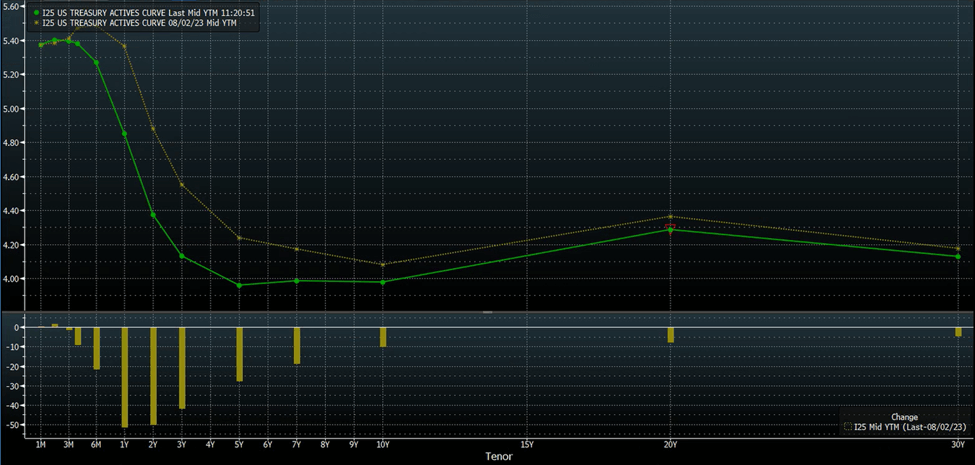
3. Treasury Yield Curve (Current QE4-2023 vs. Q3-2023)
The current yield curve, represented in yellow demonstrates an inverted yield curve, where the cost of long-term borrowing is cheaper than short-term borrowing. It can be noted that the interest rates across the curve are lower now than one quarter prior.
*Treasury yield curves demonstrate the relationship between interest rates and time to maturity. There are three main yield curve shapes: normal upward-sloping curve (where long-term rates are higher than short-term rates), inverted downward-sloping curve (where long-term rates are lower than short-term rates), and flat where interest rates are approximately the same regardless of tenor.
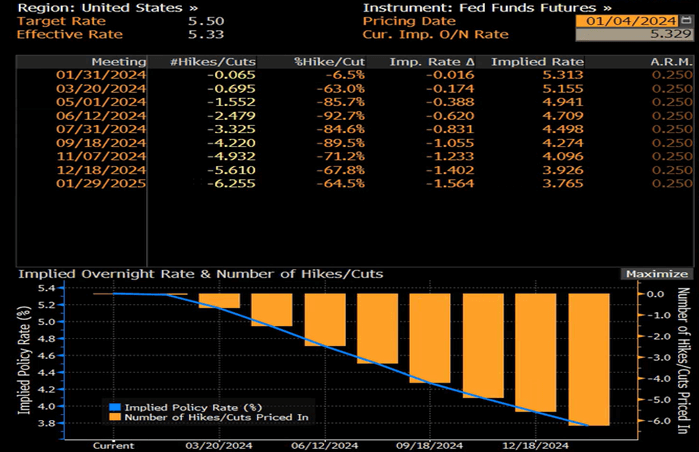
4. World Interest Rate Probability
This chart uses market sentiment data to project the probability of the Fed's rate action at future meetings. The far-left column shows the upcoming Fed meeting dates while the next two columns show the expected number and probability of hikes/cuts. The next two columns show the implied rate change and the implied rate.
Generally, if the market only prices in < 60% of a movement (hike or cut), there remains a lot of uncertainty as to what the Fed would do. When it approaches 60%, then it gets a little more serious. If the market is misaligned in that case, someone from the Fed will likely speak out to adjust market expectations. If we use this "rule," then the market is serious about a cut by the end of Q1-2024.
by Chris Tollinchi
Share this ![]()